

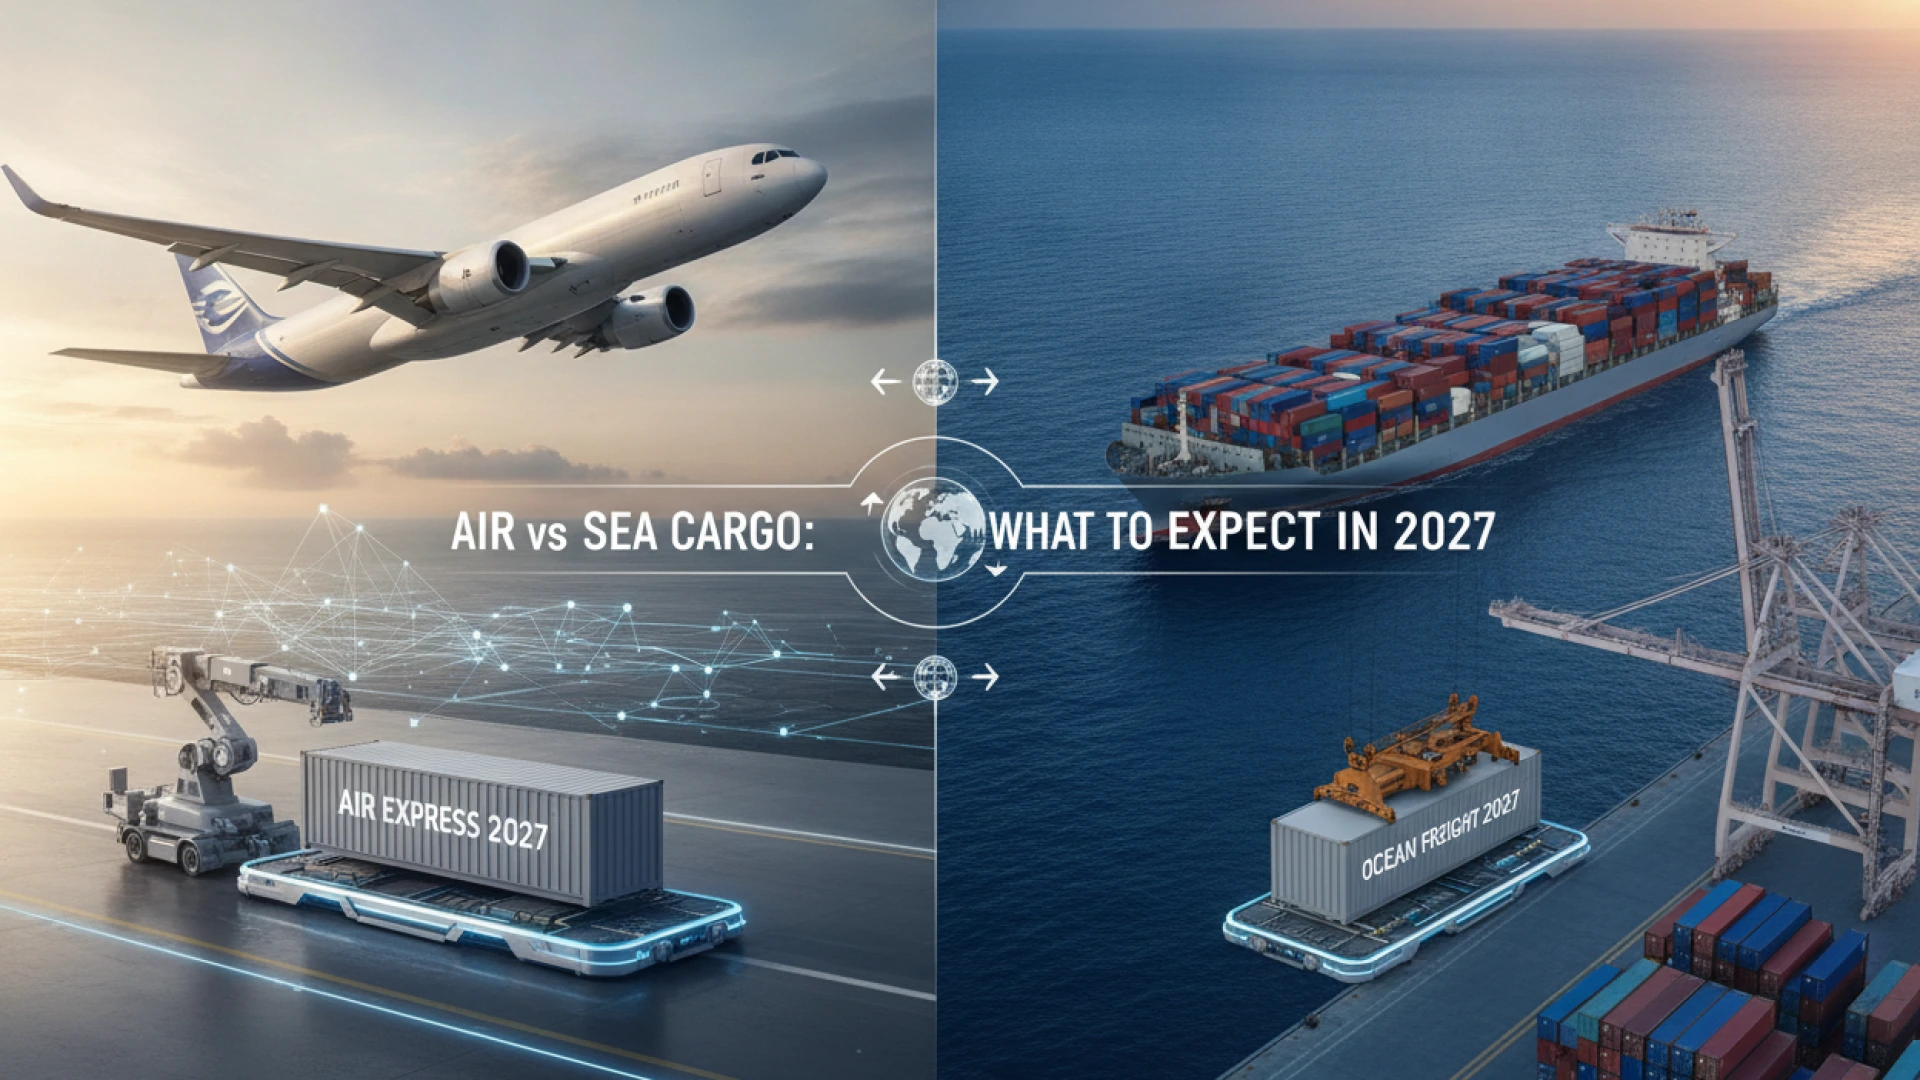
What Is the Core Difference Between Air vs Sea Cargo in Today’s Supply Chain?
If your supplier pings you to say a production batch finished two days late, your next move usually comes down to one brutal calculation: burn margin on a flight, or risk stockouts on the water. That is the daily reality of navigating air vs sea cargo. Deciding between them isn’t just about moving boxes from point A to point B; it’s an ongoing tug-of-war between velocity and cash flow.
At a operational level, the baseline trade-offs look like this:
| Metric | Air Cargo | Sea Cargo (Ocean Freight) |
|---|---|---|
| Typical Transit | 1 to 7 days (door-to-door) | 20 to 45+ days (port-to-port) |
| Payload Scale | Measured in kilograms; tight volumetric limits | Measured in TEUs (20ft/40ft containers); metric tons |
| Primary Pricing Metric | Chargeable weight (actual vs. dimensional volume) | Container spot rate or volume per cubic meter (CBM) |
Air freight functions like the emergency room of your logistics network. You use it when keeping inventory lean—or saving an enterprise client relationship—outweighs the gut-punch of high rates. It is built for small, dense, or rapidly expiring items: lithium-ion electronics, urgent pharmaceutical cold-chains, and automotive components needed on an assembly line by Friday.
Ocean freight, by contrast, is the backbone of global commerce. It moves the slow, heavy, and price-sensitive freight that would bankrupt you in the air: raw commodities, furniture, apparel runs, and industrial machinery.
The strategy behind choosing one over the other has shifted dramatically. Following years of severe port bottlenecks and blank sailings, many logistics managers abandoned strict “just-in-time” models in favor of holding safety stock (“just-in-case”). That shift filled regional warehouses to the rafters, temporarily eased ocean carrier demand, and forced planners to rethink how they split purchase orders. Below, we’ll break down exact landed-cost mechanics, emissions benchmarks, and the operational shifts you must plan for as we head toward 2027.
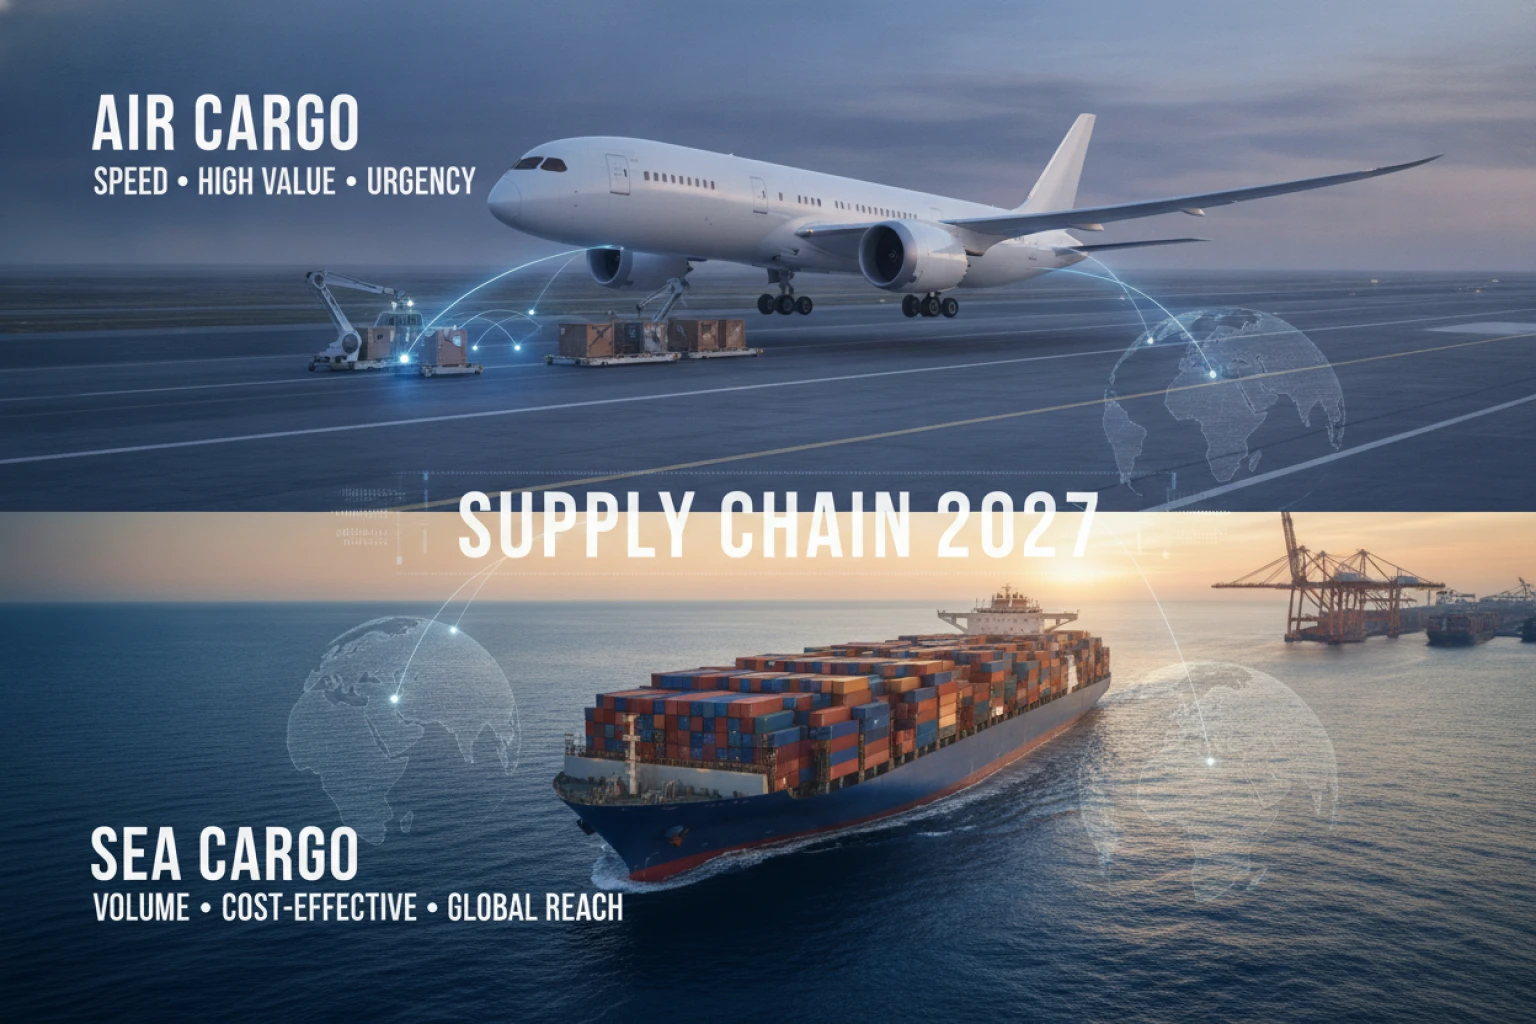
Air vs Sea Cargo Cost Comparison Transit Times, Tariffs, and Surcharges
Comparing air vs sea cargo costs isn’t as simple as checking base freight rates. The math changes the moment you measure your cargo and factor in destination dwell times.
Air cargo bills on whichever is higher: actual gross weight or volumetric weight (using the standard IATA 1:6000 divisor, or roughly 167 kg per cubic meter).
| Metric / Surcharge | Air Freight Standard | Ocean Freight Standard |
|---|---|---|
| Chargeable Ratio | 1 CBM = ~167 kg | 1 CBM = 1,000 kg |
| Fuel Mechanism | FSC (indexed per kg) | BAF (per TEU or CBM) |
| Currency Risk | Built into spot tariffs | CAF (% added to ocean base) |
| Port / Ramp Fees | Terminal Handling per kg | THC per container/CBM |
The pricing tipping point usually lives between 100 kg and 300 kg. Past 300 kg or 2 CBM, ocean consolidation almost always runs cheaper—assuming your working capital can tolerate a 30-day sail.
Watch the secondary fees closely. Air imports face steep terminal handling charges (THC) and aggressive bonded storage rates that kick in after just 48 hours of free time.
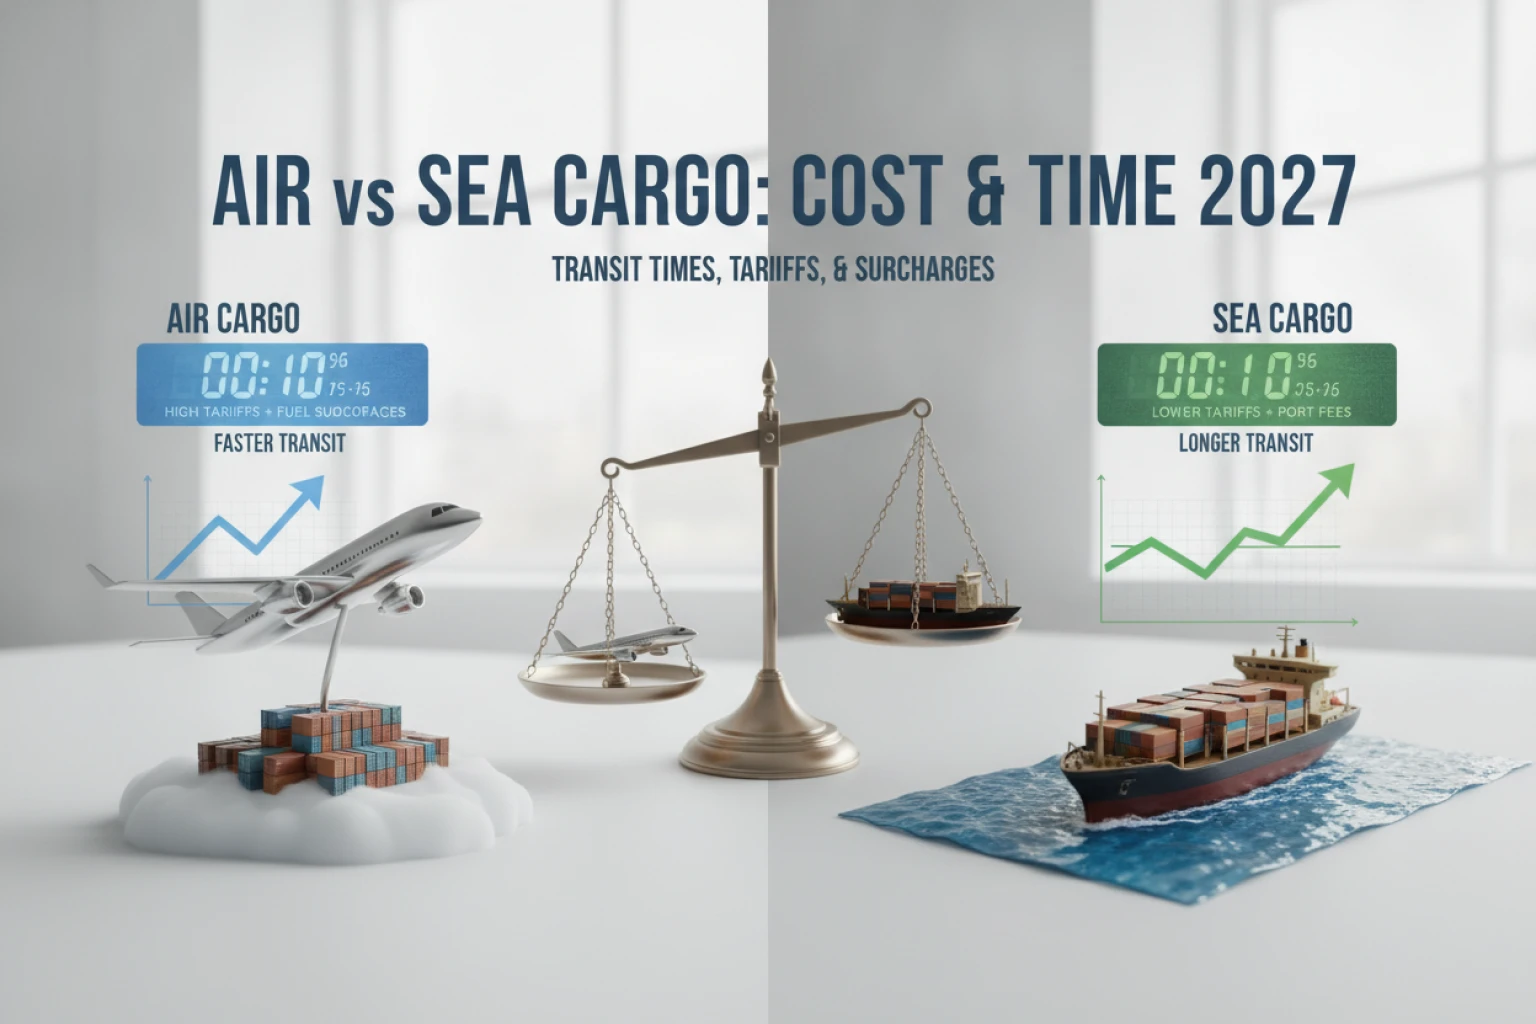
How Will 2027 Regulations and Green Fuel Mandates Impact Freight Rates?
On the water, ocean carriers face stricter Carbon Intensity Indicator (CII) thresholds under the International Maritime Organization’s 2030 trajectory. Ships rated D or E will have to slow-steam or cut engine output, reducing usable weekly capacity on long-haul routes. Combined with the phased-in EU Emissions Trading System (EU ETS)—which hits 100% of reported emissions for European voyages in 2026—ocean freight will carry non-negotiable compliance surcharges. Air freight faces an even steeper regulatory hill. Mandates like the EU’s ReFuelEU Aviation initiative enforce progressive Sustainable Aviation Fuel (SAF) blending minimums heading into 2027.
| Regulatory Driver | Ocean Freight (Sea) | Air Freight |
|---|---|---|
| Direct Fuel Cost | Surcharges for green methanol/bio-bunkers | Mandatory SAF blends (approx. 2%–6% floor) |
| Capacity Friction | Slow-steaming to preserve CII ratings | Payload penalties on early hybrid retrofits |
| Carbon Pricing | Full EU ETS application on regional port calls | Tightening EU ETS free allowance phase-outs |
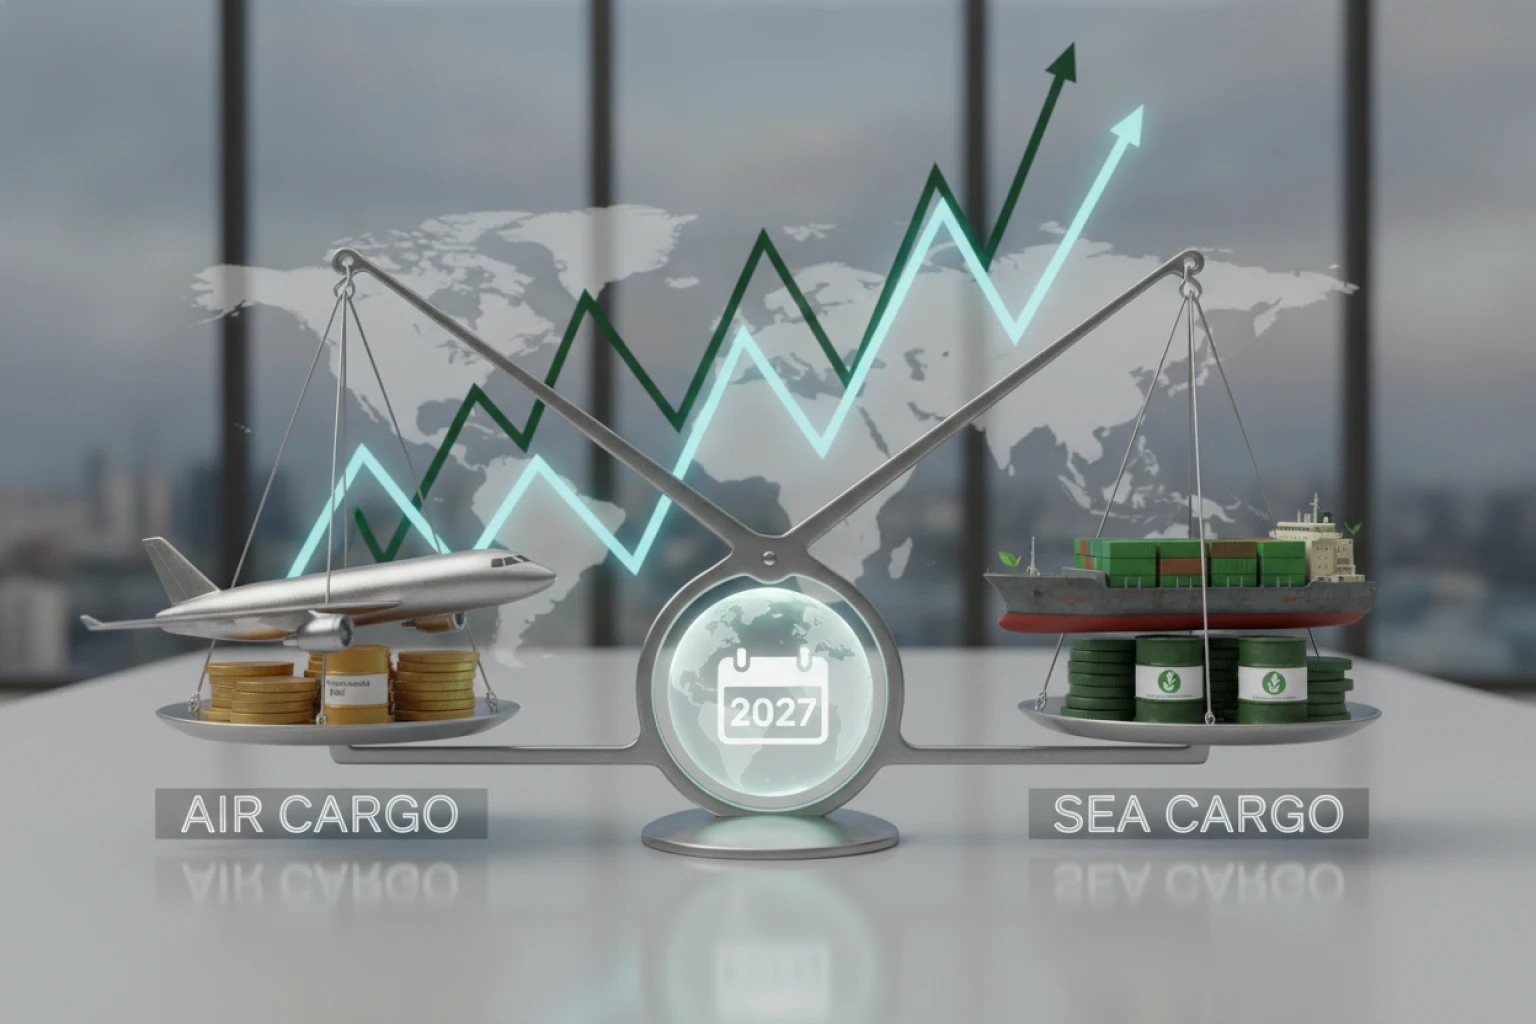
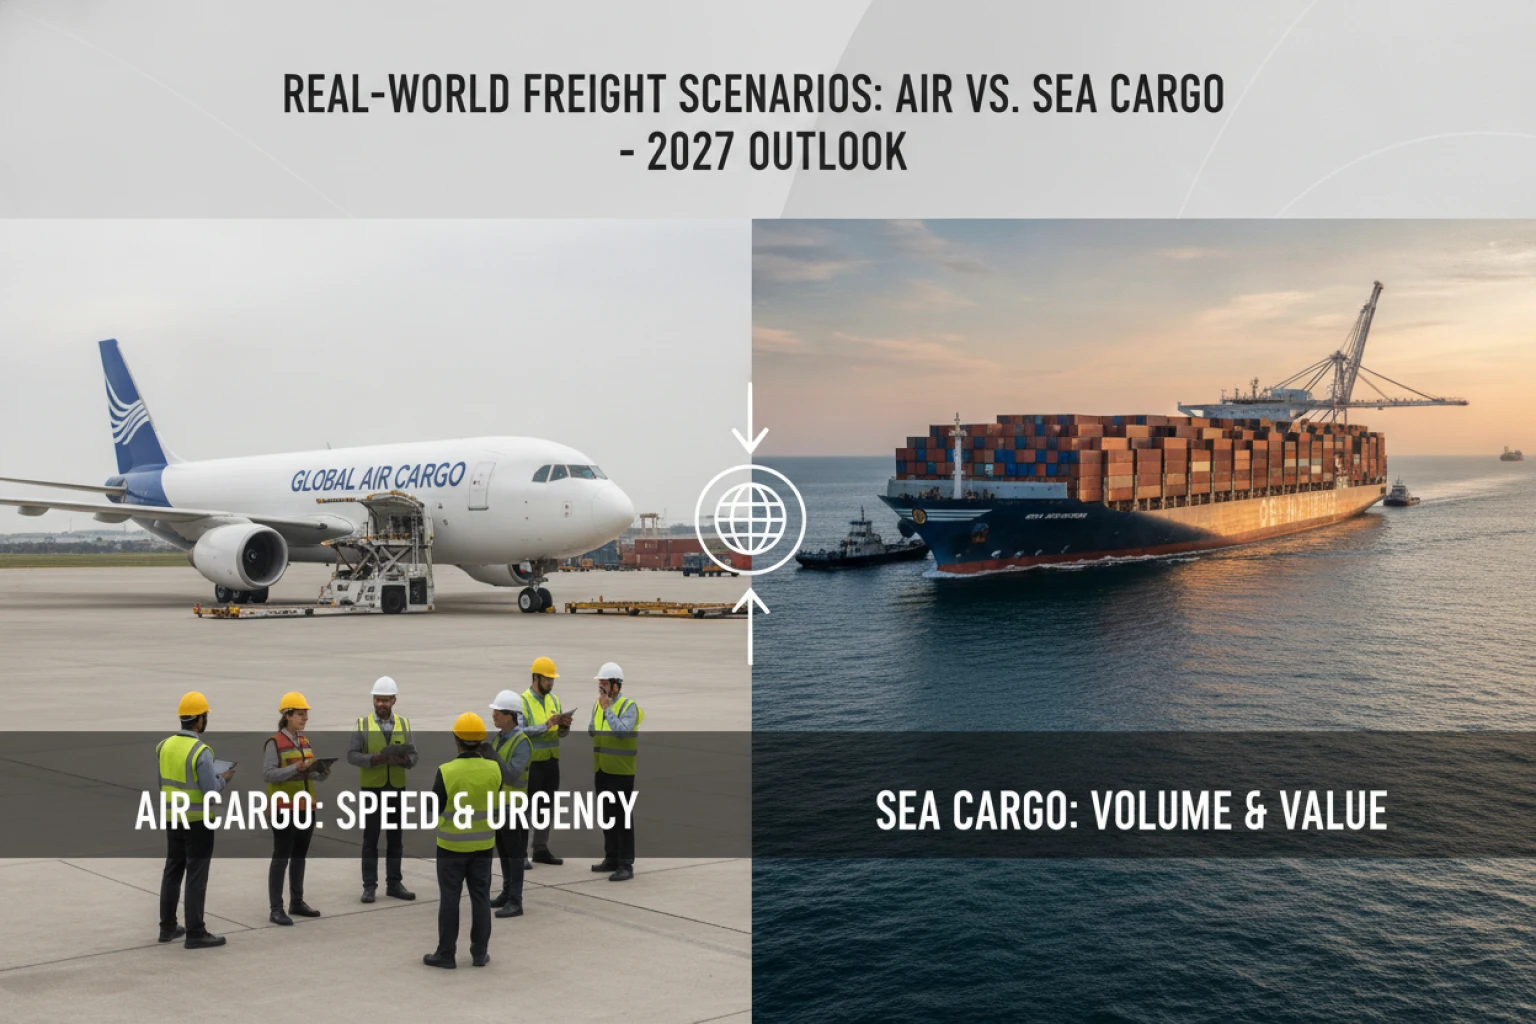
Real-World Freight Scenarios: When to Choose Air vs Sea Cargo
Theoretical cost-per-kilo formulas look tidy on a spreadsheet, but real supply chain decisions happen under messy operational pressure. The choice between air vs sea cargo usually comes down to whether speed can preserve gross margin—or if paying for that speed wipes it out entirely.
Here is how experienced logistics managers weigh the trade-offs on the floor:
Fast-fashion retail launch
A European apparel label preparing for autumn demand faces production bottlenecks in Vietnam. Missing the retail window means steep discounting.
Heavy plant machinery
A Midwest manufacturing supplier ships four CNC milling units weighing 18 metric tons from Germany. Air freight quotes reach nearly 40% of the equipment’s value. The business opts for standard 40-foot flat-rack FCL ocean freight. The six-week door-to-door transit is managed by building standard buffer stock at the local distribution hub, keeping unit economics intact.
Active pharmaceutical cold chain
A regional healthcare buyer imports vaccines with a 24-month stability profile.Real-time telematics track internal container temperatures throughout the 22-day voyage, slashing transport costs by roughly two-thirds without risking product integrity.
| Decision Factor | Lean Air Cargo | Lean Sea Cargo |
|---|---|---|
| Product Margin | High (>40% to absorb premium rates) | Tight or low (bulk volume dependency) |
| Cargo Shelf Life | Days to weeks; rapid obsolescence | Several months to years; stable goods |
| Inventory Carrying Cost | Capital tied up is painfully expensive | Financing cost is low enough to float transit |
| Lead-Time Sensitivity | Factory-down emergencies or stockout risk | Planned replenishment with standard lead times |
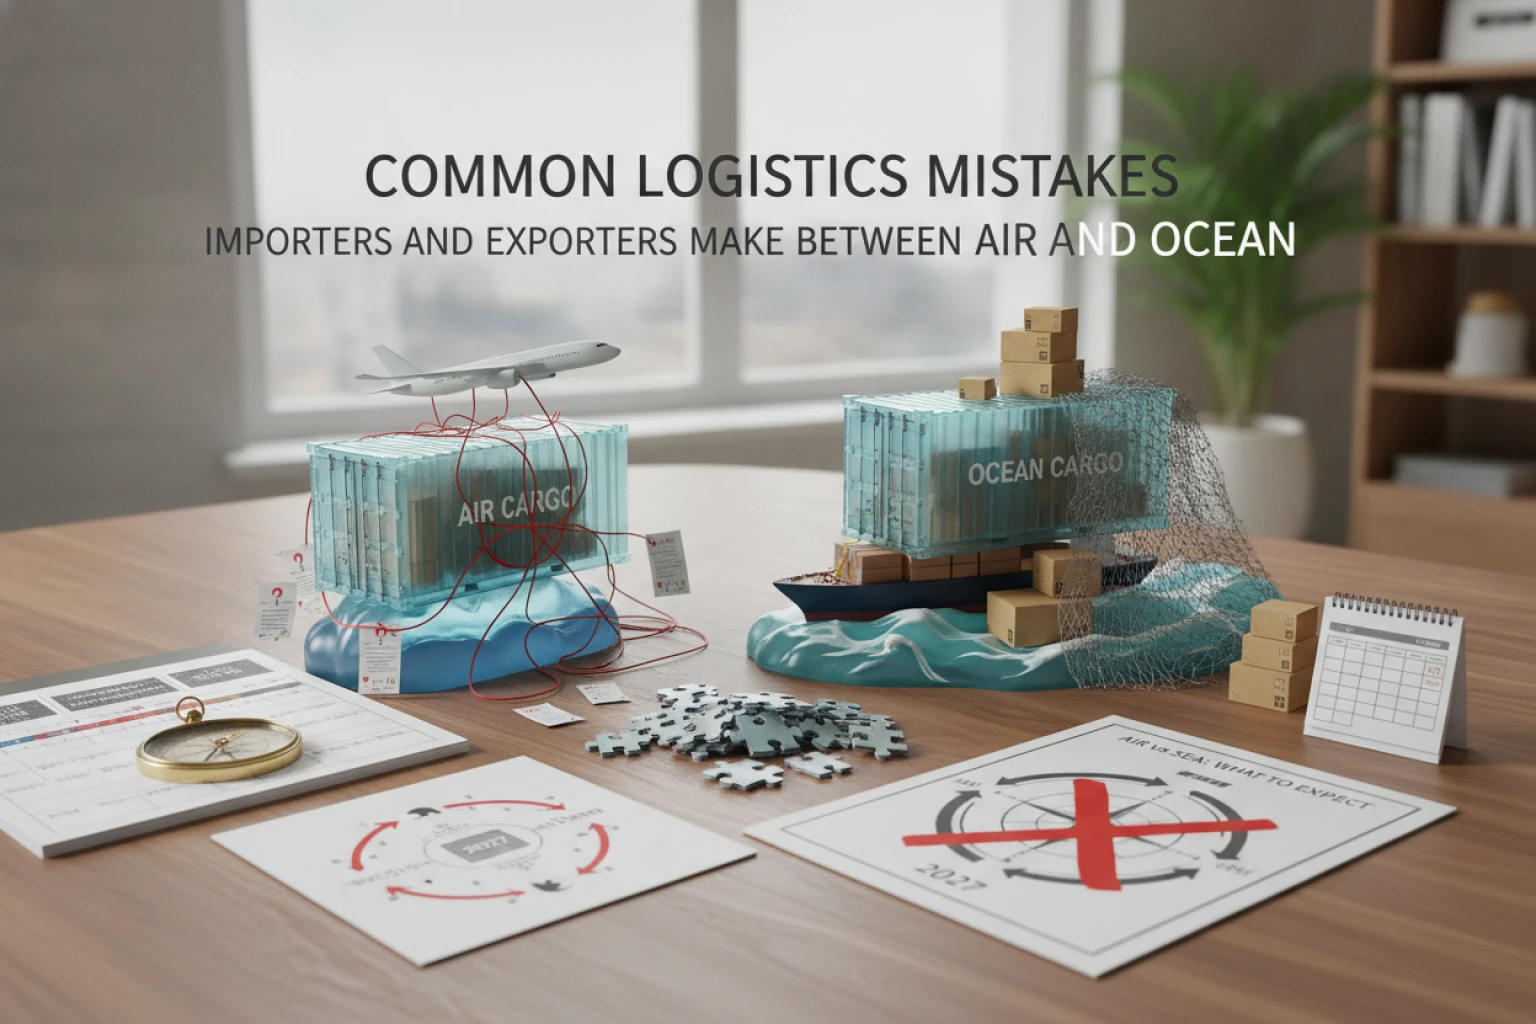
Common Logistics Mistakes Importers and Exporters Make Between Air and Ocean
Most freight budget blowouts don’t stem from carrier rate spikes; they happen because shippers treat modal selection as an afterthought. When evaluating air vs sea cargo, teams repeatedly fall into a few expensive operational traps.
Treating Air Freight as a Forecasting Band-Aid
The most damaging habit is using spot air cargo to salvage chronic demand-forecasting misses.
Comparing Base Quotes Instead of Total Landed Cost (TLC)
Shippers often weigh a $4,000 ocean container against a $14,000 air charter and assume ocean wins hands down.
They forget to tally:
Destination dwell and demurrage
Often accumulating while paperwork clears.
Chassis splits and domestic drayage
Congestion surcharges quickly erode margins.
Working capital drag
Financing inventory sitting idle on water for 35 days.
| Cost Component | Ocean LCL Trap | Air Freight Reality |
|---|---|---|
| Base Rate | Extremely low per CBM | High per chargeable kg |
| Terminal Handling | CFS deconsolidation fees add up fast | Minimal cargo terminal fees |
| Transit Predictability | Prone to 5–10 day port rollovers | Predictable 2–5 day door-to-door |
Blindly Defaulting to LCL Over Air
For shipments between 1 to 3 cubic meters, booking Less-than-Container Load (LCL) ocean freight often backfires. Between Container Freight Station (CFS) cutoff dates at origin and deconsolidation queues at destination, LCL can add two weeks to standard ocean transit times. By the time CFS release fees are paid, the cost advantage over deferred air freight evaporates.
Overlooking Sea-Air Hybrid Corridors
Shippers tend to view transport as a binary choice: wait five weeks for water, or pay top dollar for flight. That mindset ignores multimodal options.
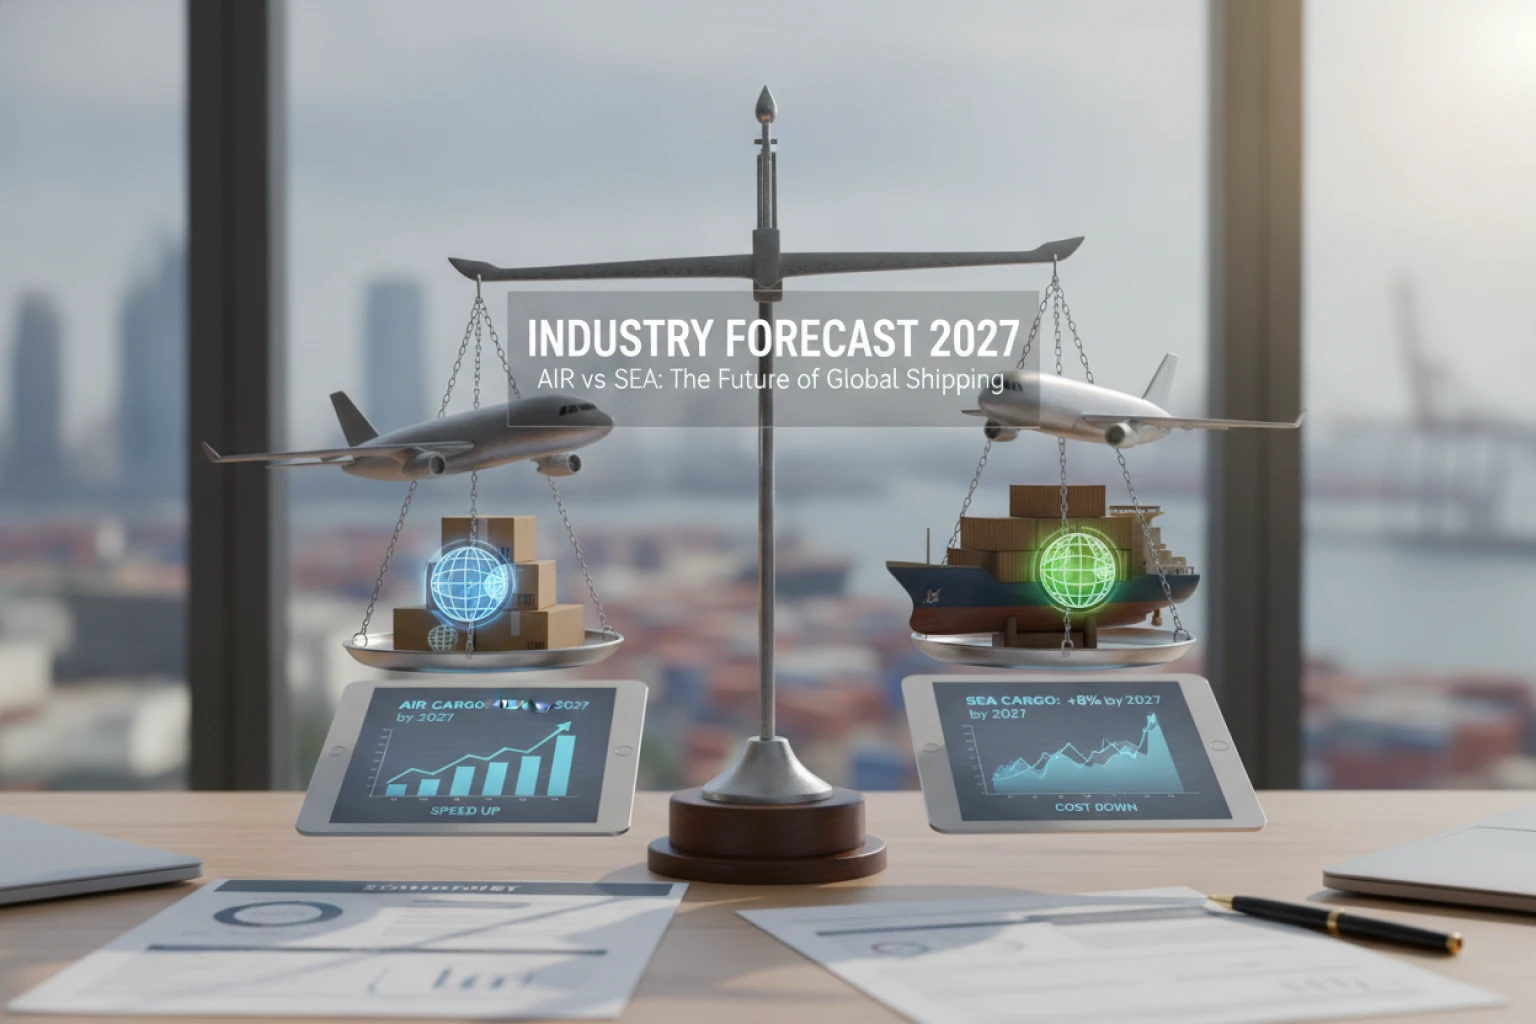
What Industry Data and Global Shipping Authorities Project for 2027
The balance between air vs sea cargo is heading toward a structural reset by 2027, driven by an influx of ocean hardware and smarter airport tarmac processing.
Air freight tells a split story. IATA capacity reports indicate that passenger widebody deliveries are flooding key transpacific and transatlantic routes with cheap belly-hold space.
Ground bottlenecks are shifting too. World Customs Organization (WCO) data-sharing standards and digitized air cargo manifests are expected to trim terminal dwell times by 20–30% across primary hubs by 2027, erasing some of ocean shipping’s door-to-door gains.
| Freight Channel | 2027 Supply Outlook | Operational Bottleneck to Watch |
|---|---|---|
| Ocean (TEU) | Chronic overcapacity risk; soft base rates | Port-side container chassis deficits |
| Air Belly-Hold | Surplus space on major passenger routes | Limited acceptance of heavy out-of-gauge skids |
| Main-Deck Air | Deficits in dedicated freighters | Stricter battery and hazmat staging checks |
Positioning Your 2027 Supply Chain
Do not commit to long-term ocean volume tiers at fixed rates right now; let the carrier overcapacity work in your favor on index-linked contracts. For air cargo, secure direct allocations with forwarders holding dedicated freighter charters on secondary lanes where passenger flights rarely operate.
FAQS
How will decarbonization rules shift air vs sea cargo choices by 2027?
Tighter maritime mandates (like the expanded EU ETS and FuelEU Maritime) and aviation’s CORSIA requirements are pushing green premiums onto base rates. Historically, shippers viewed ocean freight as the default low-emission alternative. By 2027, the gap narrows on paper as carriers pass down compliance surcharges for sustainable aviation fuel (SAF) and bio-methanol bunkers.
| 2027 Planning Metric | Air Cargo | Sea Cargo |
|---|---|---|
| Emission surcharges | SAF mandates add 3–7% to lane rates | Carbon allowances built into bunker formulas |
| Speed vs. clean fuel trade-off | Fast transit, high fossil displacement cost | Slow steaming adds 2–4 days to burn less fuel |
| Capacity bottlenecks | Belly-hold space tied to passenger routes | Ultra-large container vessels on fixed alliance loops |
Should you ever shift standard cargo to air in 2027?
Usually, no. Booking air for heavy, non-perishable goods is still an expensive mistake born of poor planning. But real-world exceptions crop up:
Factory line-down risks
When a missing component threatens production, air freight is cheap insurance.
Capital drag
If inventory carrying costs on high-value items outweigh the 4x to 6x freight rate multiple, flying makes financial sense.
Port labor disruptions
Air is a tactical escape hatch, not a sustainable replenishment model.